Cryptocurrency Staking Stats: All You Need to Know

Cryptocurrency staking has become a popular method for investors to earn passive income while participating in a blockchain ecosystem.
Depending on the network, you can earn staking rewards anywhere between a low single-digit annual percentage return (APR) to high double-digit returns. Staking is truly a lucrative investment option.
As the staking ecosystem grows in complexity, analyzing staking data can help you make informed decisions and maximize your staking rewards.
In this article, we will tackle the following:
- What are staking statistics
- The benefits of monitoring staking data
- Staking industry data
…among other things. Read on to learn more!
What are Staking Statistics?
Staking data refers to information and metrics that provide insights into the performance of a staking ecosystem. Knowing how to interpret staking data is important as it may affect your staking rewards.

Here are examples of essential staking data:
- Annual Percentage Rate (APR): Perhaps the most important statistic for investors, APR refers to the network’s % staking return. The higher the rate the more staking rewards to be earned.
-
- Total Value Locked (TVL): TVL tells how much crypto assets are locked into a network or staking protocol. This can be expressed in US Dollar terms or tokens staked.
- Total Validators: Crypto staking relies on a decentralized network of third parties to validate transactions and keep the network secure. These validators earn staking rewards in return.
- Total Nominators: Relevant to Delegated-Proof-of-Stake networks such as Polkadot, nominators select validators. The former can be seen as the total individual participants in the staking network.
- Staking Ratio: Not to be confused with staking participation rate, a similar staking metric, the staking ratio computes how much of a network’s total token supply is staked.
When taken together, these staking data enable you to assess a blockchain’s health, growth, and potential staking rewards.
Monitoring Staking Data to Maximize Staking Rewards
Beyond finding the highest staking rewards, you can use staking data to gain insights into a network’s security and growth potential.
Identify Profitable Opportunities

By analyzing staking metrics, you can identify cryptocurrencies with attractive staking rewards and growth potential. This enables you to allocate your staked tokens more efficiently.
For example, increasing staking participants as well as a rising TVL indicate that the market is shifting towards a certain blockchain or protocol. Profitable staking rewards and promising growth usually underlie these networks and protocols.
Pendle Finance, a cross-chain staking protocol, has been a rising star in the staking scene. Its TVL has grown exponentially from $15 million at the start of 2023 to over $3 billion as of writing.
Practice Risk Management
Staking statistics provide insights into a network’s level of security. In addition, some participants prefer to engage with networks that follow blockchain’s core principle of decentralization.
A high staking ratio (as a rule of thumb 25% is used) generally signifies a healthy network, as more participants are involved in keeping the network secure. However, this must be combined with other data, such as the total number of validators. A network may have a high staking ratio but a low validator count, indicating decentralization.
Large networks such as Tron and BNB Smart Chain have 27 and 56 validators, respectively. Compare this with Ethereum and Solana, which have over 1,000 validators each.
Optimize Staking Strategies
You can adjust your portfolio strategy based on real-time staking data.
If APRs on a certain staking protocol have fallen below your benchmark rate, you can use this data to shift your crypto assets to another venue. Similarly, if another staking method – Ethereum (ETH) liquid staking is yielding more APR than ETH solo staking, you may choose to switch to liquid staking instead.
Factors like staking rewards and network dynamics are huge in determining staking strategies.
Staking Industry Data
Staking data can be used to analyze different facets of the market, from networks to protocols, to various staking methods. Each analysis represents an opportunity to review your assets at risk.
Ethereum vs Solana
To illustrate the importance of staking data, let’s look more closely at Ethereum (ETH) and Solana (SOL). The two are the largest and 2nd largest staking networks by TVL as well as the 2nd and 5th largest blockchains by market capitalization, respectively.
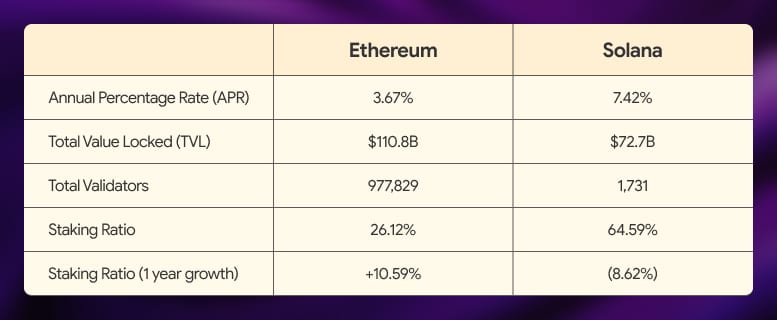
Data obtained from various sources such as Staking Rewards and Coinbase.
You can quickly see that staking SOL allows you to earn double the staking rewards of ETH. Furthermore SOL has almost triple the staking ratio of ETH, indicating greater participation.
However, ETH has nearly a million validators indicating more decentralization than SOL. The Staking Ratio of SOL has also decreased over one year. Staking participants have even decreased.
To provide better insights, you can also utilize non-staking data such as inflation rate and developer activity. In the case above, Solana has a 6.18% inflation rate, which may cause the price of your staked assets and staking rewards to decrease over time. On the other hand, ETH is deflationary.
Solo Staking vs Staking Pool
Solo staking refers to ETH staking wherein you set up your own node and deposit 32 ETH to turn it into a validator. All this is performed without relying on a third party. Meanwhile, A staking pool is a third-party operated system where you pool your ETH with other stakers to meet the minimum 32 ETH.
Lido Finance is the largest liquid staking protocol on Ethereum. It provides staking rewards of 3.31% APR and represents 300,000 ETH validators. Meanwhile, there are around 65,000 solo stakers earning 3.5% in staking rewards.
While solo staking is the truest form of staking, staking pools, such as liquid staking are way more accessible. Despite lower staking rewards, the stark difference in validator count may be evidence of that.
Conclusion
The growth of the staking industry reflects the increasing adoption of staking as a viable investment and participation model in blockchain networks. Tracking this growth can help you assess trends, market sentiment, and opportunities within the staking landscape.
A good grasp of staking data plays a crucial role in thriving in the dynamic staking industry. By leveraging these statistics and considering key factors, you can make informed decisions to maximize your staking rewards.
At the very least, reflect on your personal risk tolerance.
The content of solostakers.com is for informational purposes only and should not be considered financial advice. It represents the personal views and opinions of the author(s) and is not endorsed by any financial institution or regulatory body. Cryptocurrency and staking investments carry inherent risks and readers should conduct their own research and consult with a financial professional before making any investment decisions. The owner and author(s) of solostakers.com will not be liable for any losses, damages, or consequences arising from the use of the information on this site. By accessing solostakers.com, you agree to bear full responsibility for your investment decisions.

April 25, 2024
August 4, 2025


